Apex Stats – 1000 Games (2020)
Before a stats page was added to Apex Legends, I wanted to see how I stacked up against the average player. For 1,000 games, after each match I recorded stats into this Excel file which I used to generate a dashboard in Tableau for exploratory data analysis.
View the full dashboard HERE.
CONSIDERATIONS
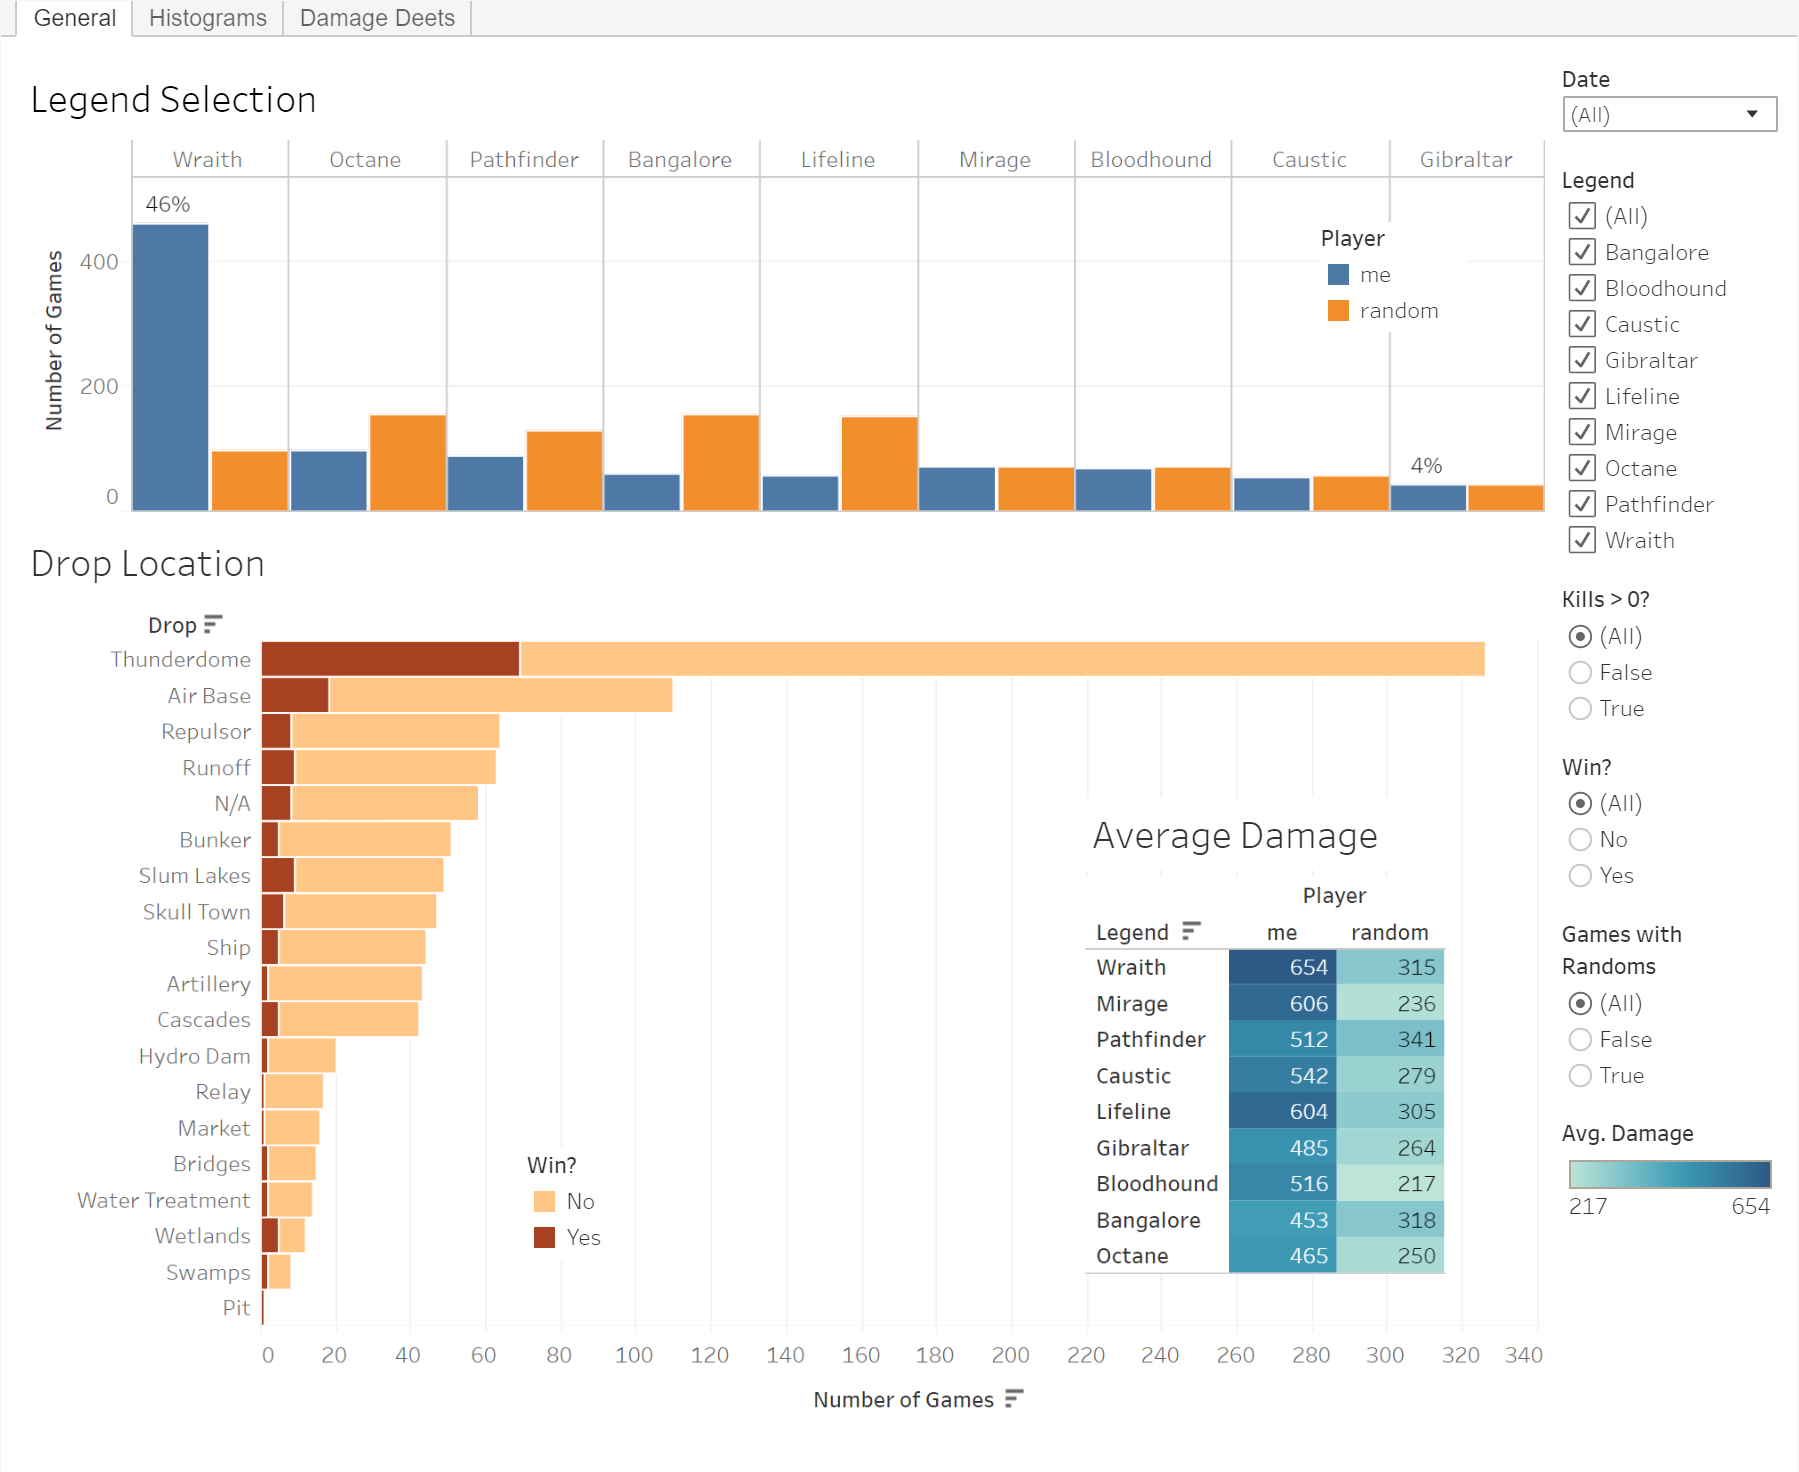
Legend selection and drop location
What legends did I play with most often and where did I like to drop? How did this compare to randoms? Were kills, damage, or W/L percentage correlated to these factors?
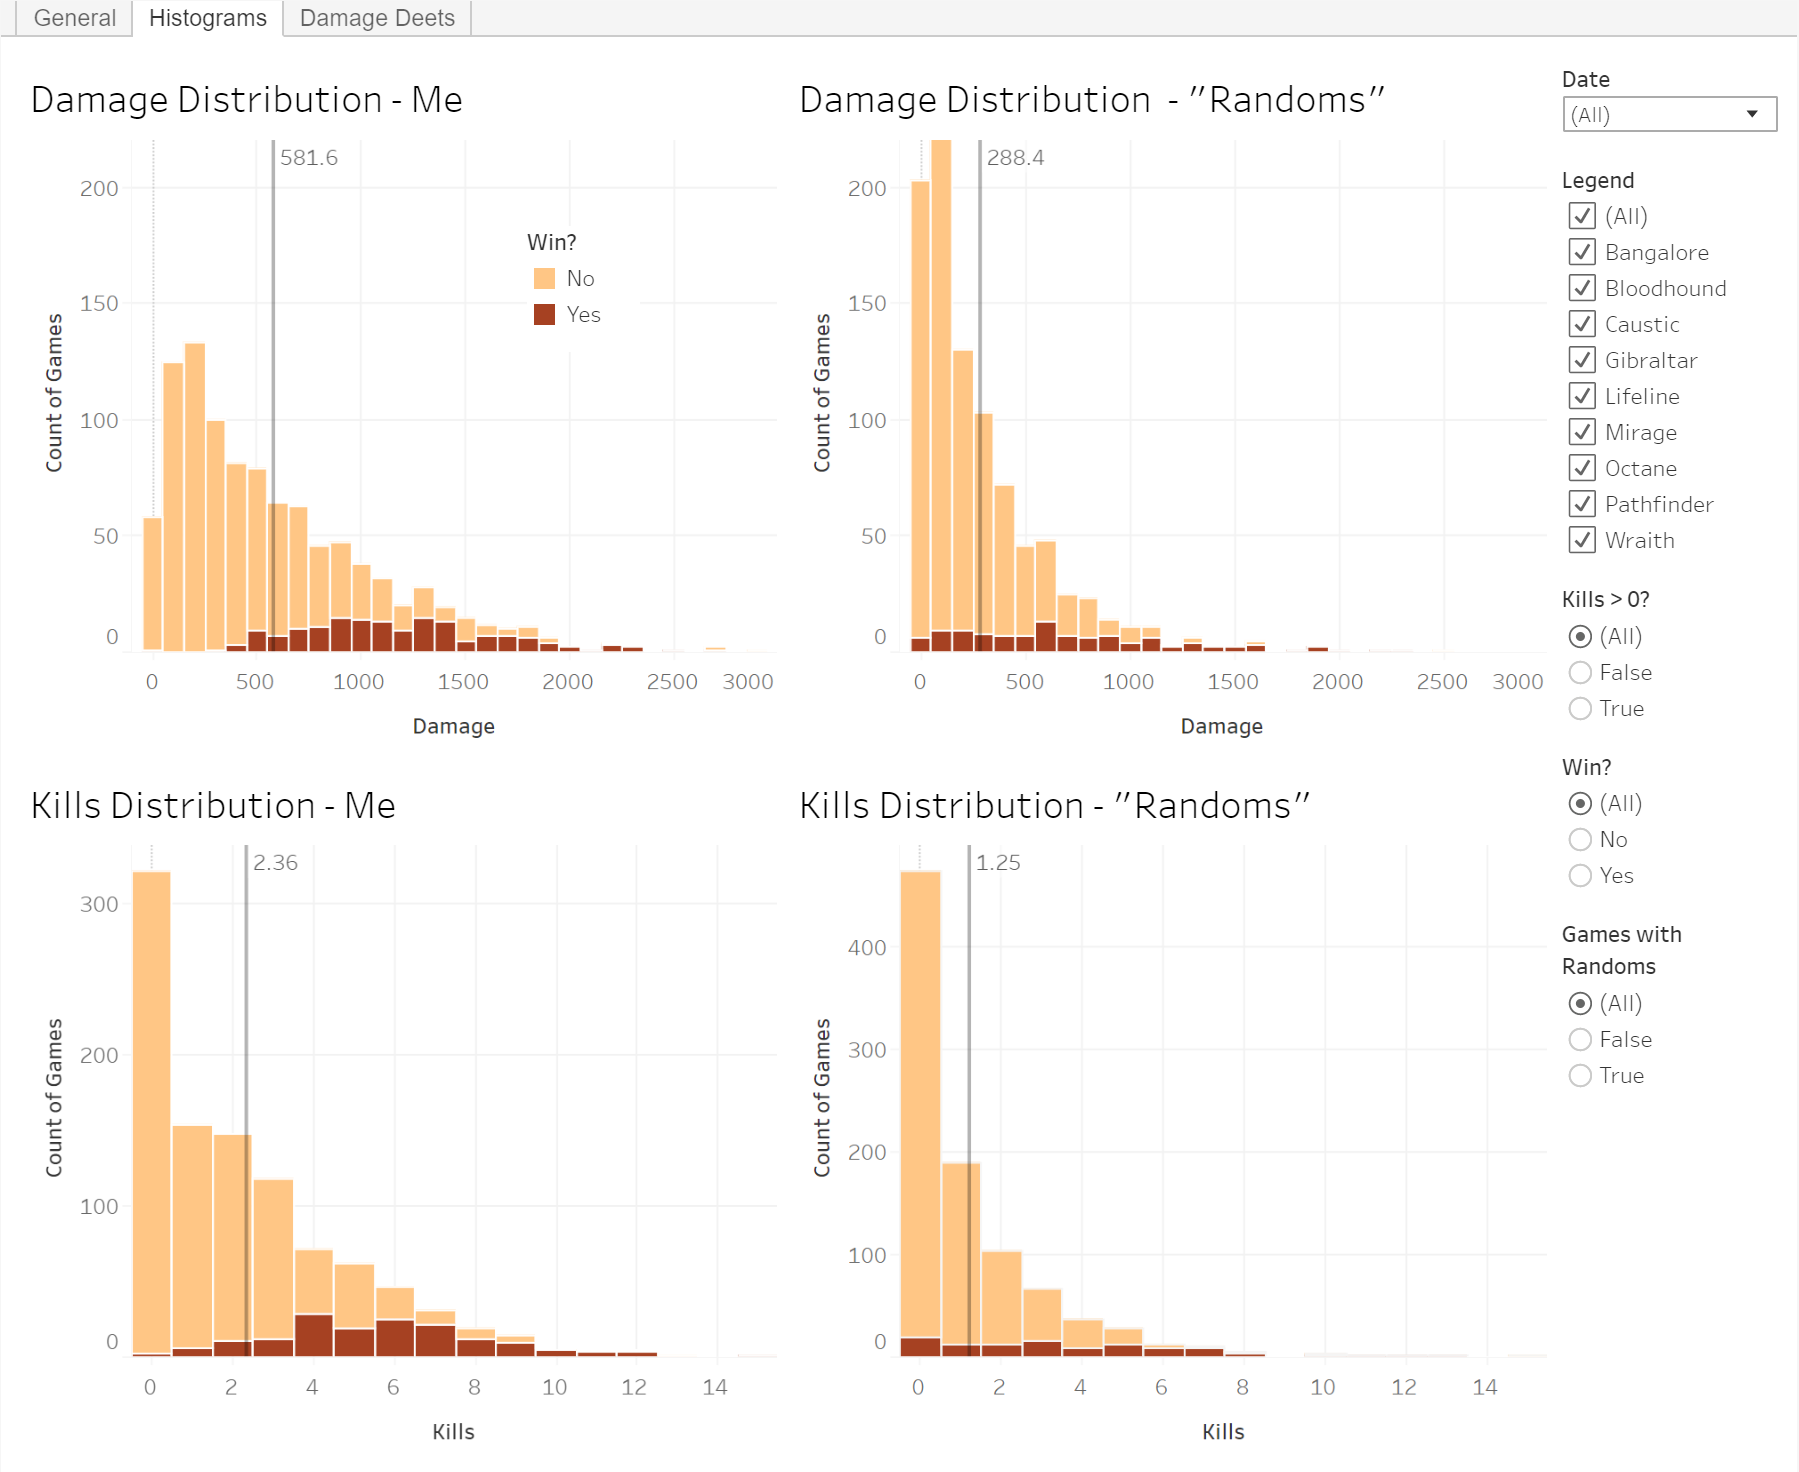
Damage and kills distributions
What did damage and kills histograms look like for randoms and myself? What about in winning games? What did my personal distribution look like in a pre-made squads vs. with randoms? What was my average damage per kill?
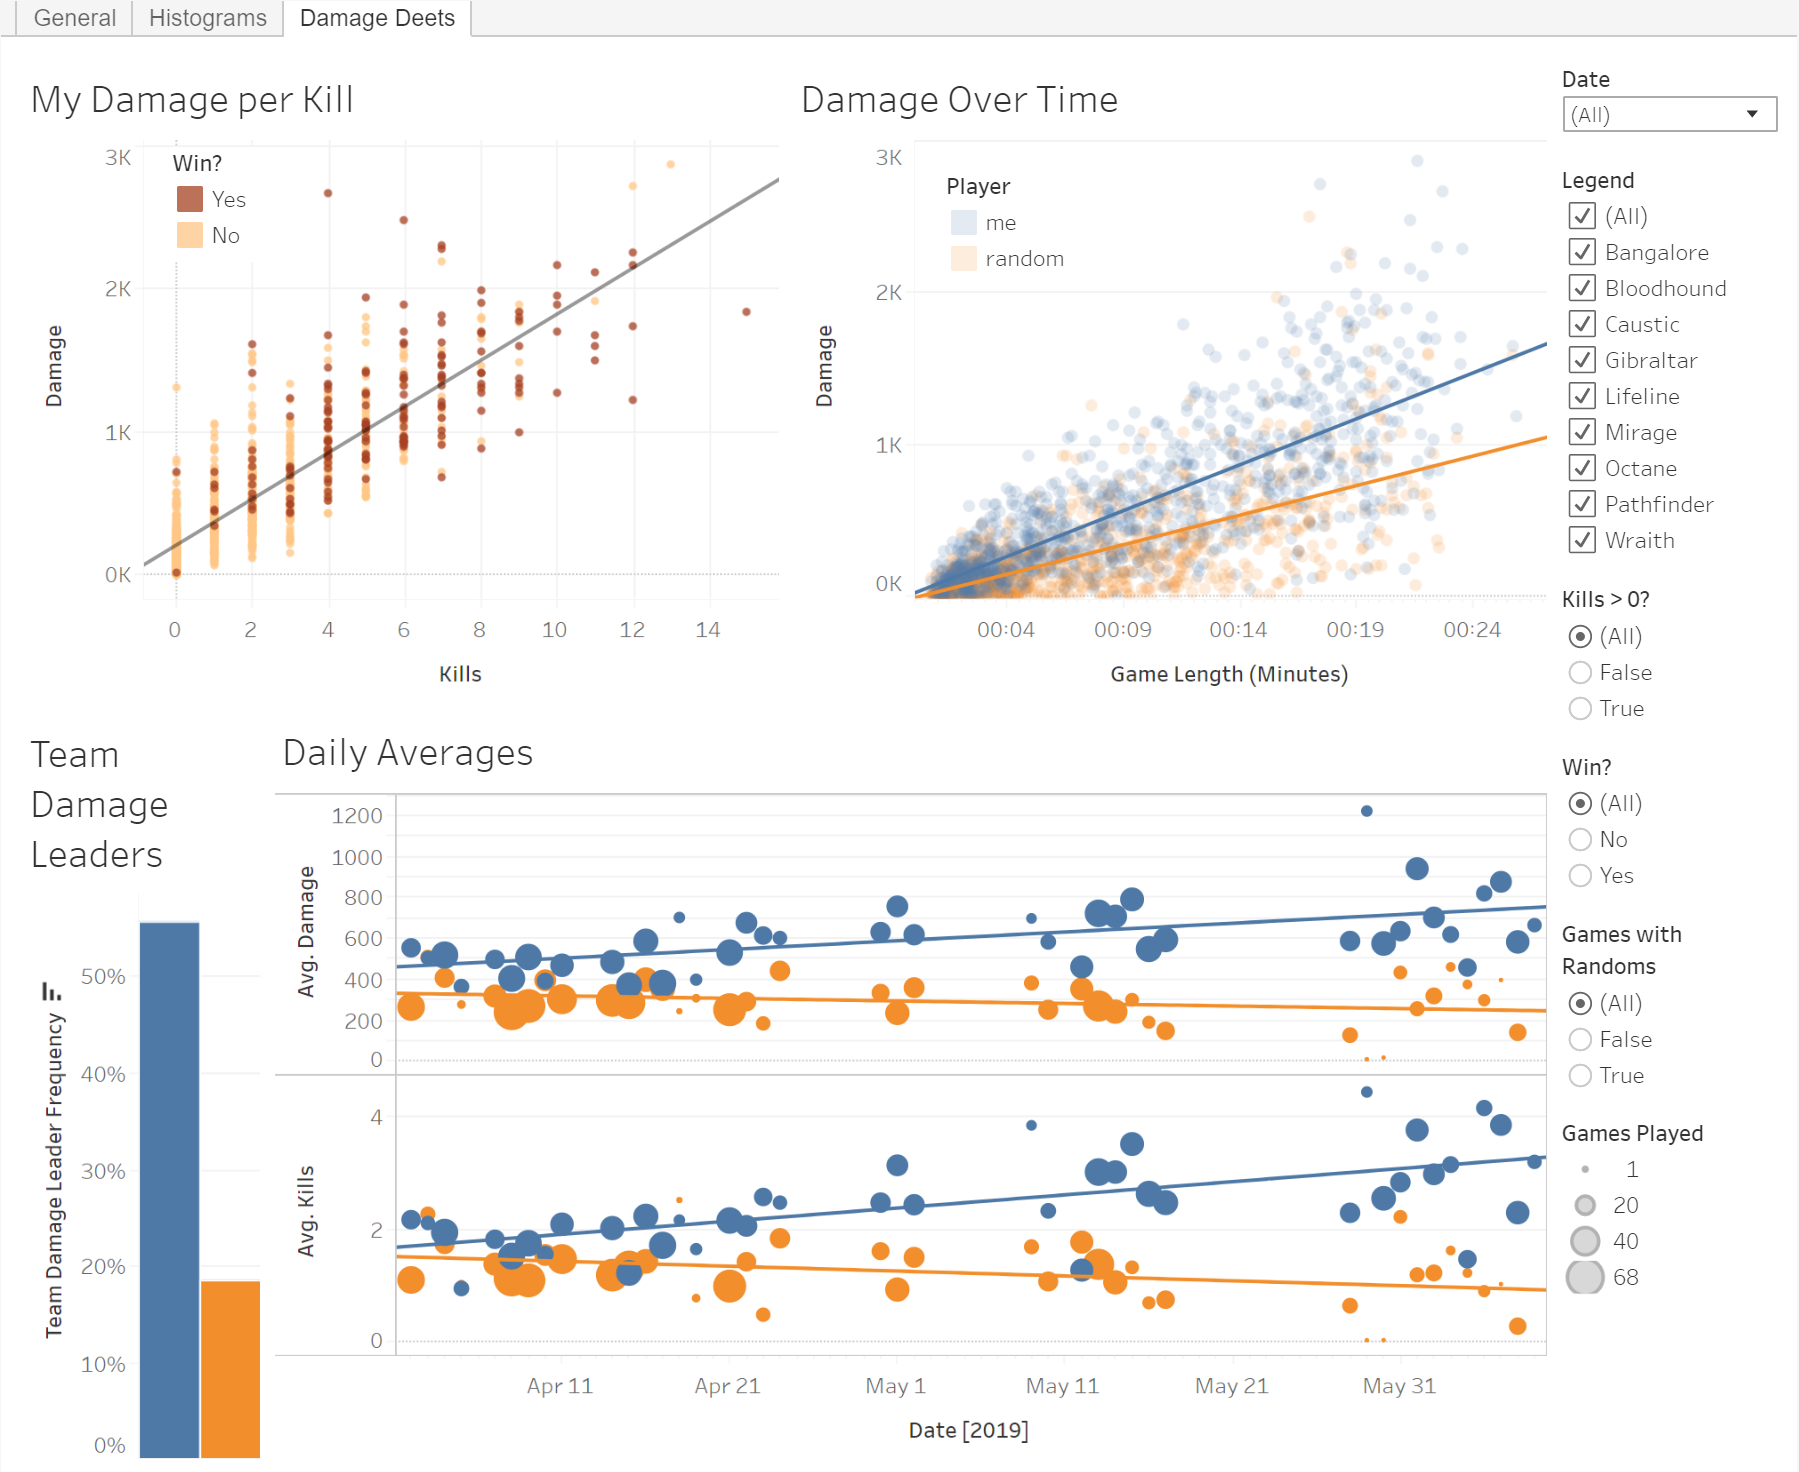
Stats with respect to time
What was my average damage per minute? How did this compare to randoms? Did I improve over time as I played the game?
CONCLUSIONS
Legend selection and drop location
With a 46% pick rate it looks like I was a Wraith main. It’s a good thing my average damage of 654 was highest with her. I landed nearly a third of my games at Thunderdome and won 27% of those games when I played in a pre-made squad. It seems my strategy of looting up there and third-partying Skull Town was effective.
Lifeline, Octane, and Bangalore each had about a 17% selection rate by randoms. Gibraltar had the lowest for both randoms and me at 5%. It’s important to note these are randoms that played with me, so their legend selection (particularly considering my high Wraith pick rate) was affected by my choice. It looks like I still liked landing at Thunderdome with randoms, but my winning percent plummeted to 16%.
Damage and kills distributions
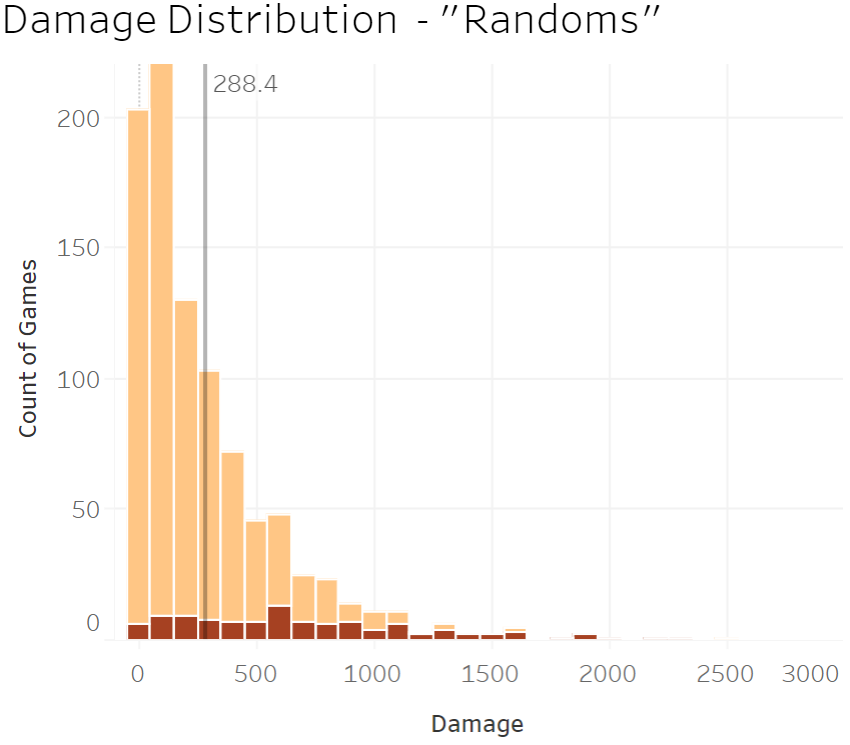
Average Damage (All Games)
| Filter | Me | Randoms |
|---|---|---|
| All | 582 | 288 |
| Games with kills | 775 | 485 |
| Wins | 1173 | 697 |
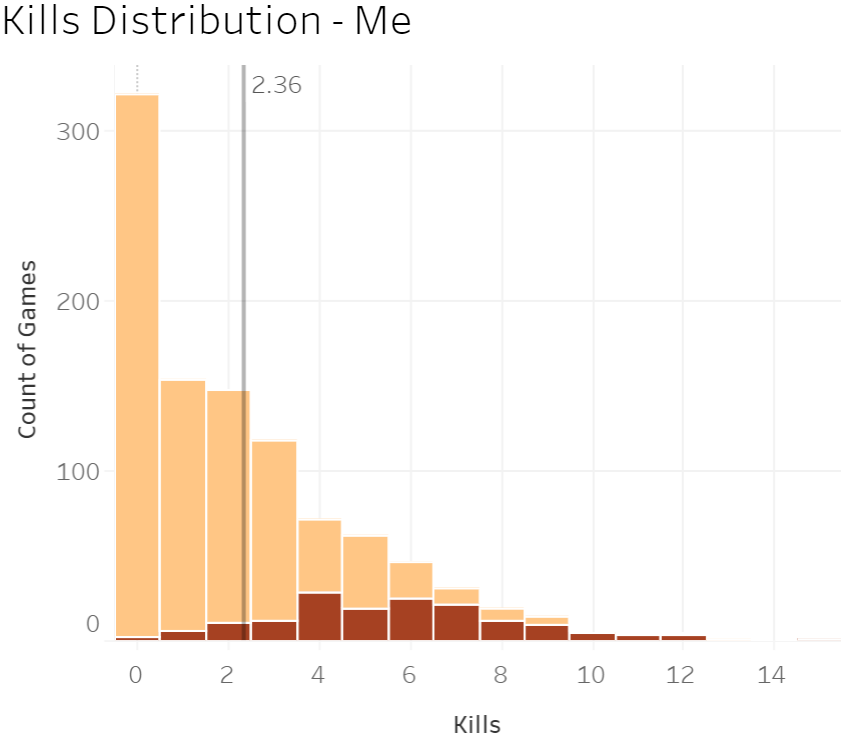
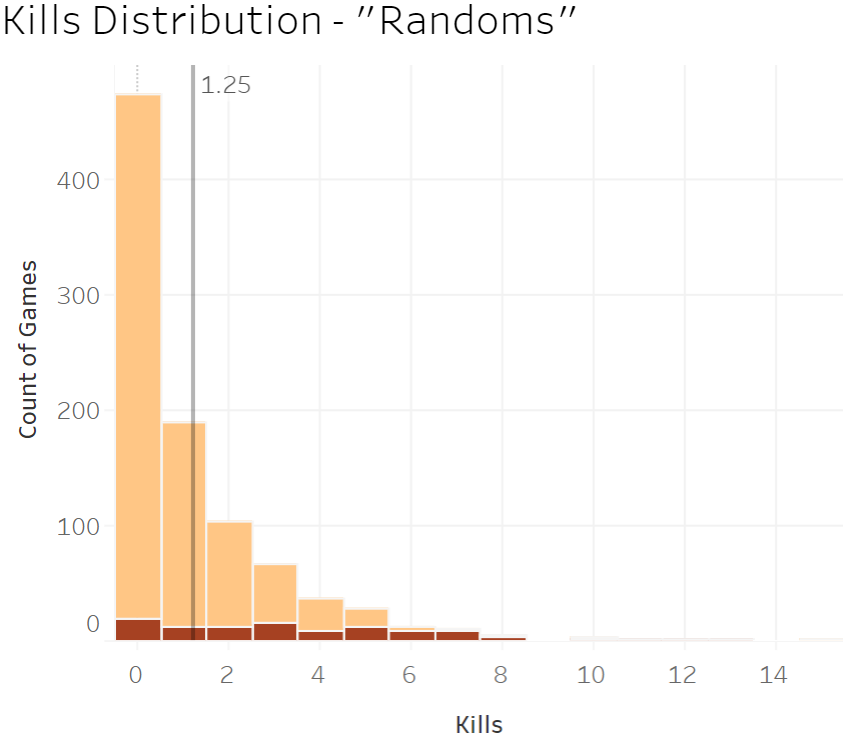
Average Kills (All Games)
| Player | Avg. Kills |
|---|---|
| Me | 2.36 |
| Randoms | 1.25 |
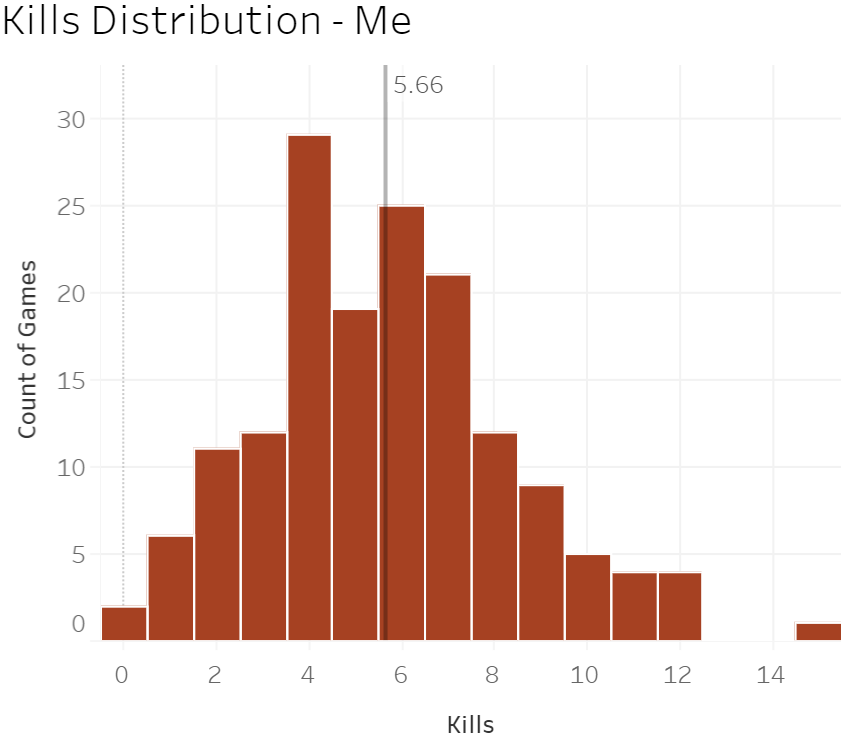
Average Kills (Only Wins)
| Player | Avg. Kills |
|---|---|
| Me | 5.66 |
| Randoms | 3.56 |
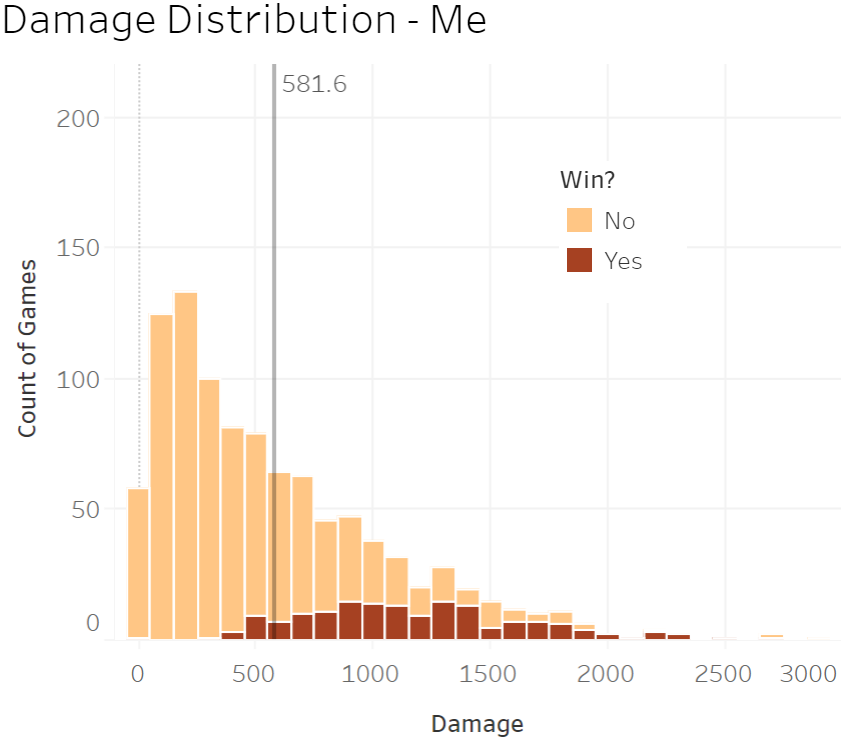
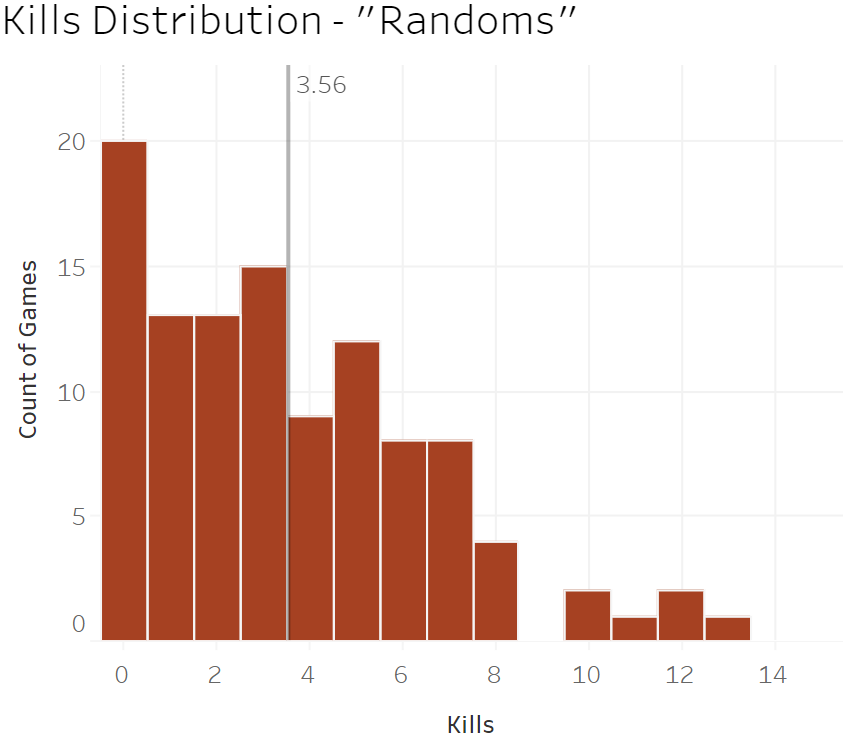
Moving the slider on any of the above histograms shows an easy visual comparison between randoms and me. For both damage and kills, the histograms skew right. This makes sense given a battle royale format, where surviving in early game is difficult and wins are hard to come by. It is easy to see, however, that my stats for both kills and damage were not as aggressively skewed as the randoms’. This accounts for my significantly higher average kills and damage.
The differences between histograms become even more apparent when considering only wins. My damage and kills distributions are nearly symmetric in these cases, whereas randoms are skewed right
Something else that caught my eye from looking at these histograms was how kills correlated to wins. In games with at least three kills, winning percentage was 37% for both the randoms and myself. Between 4+ and 5+ kills, winning percentage crossed 50%, and at 6+ kills, I won 64% of games and randoms won 72%.
Why were randoms’ winning percentages higher than mine in high kill games? Maybe it’s because these randoms were paired up with me, an above average player. If they were getting high kills, chances are I carried my own weight and we had a strong team. If I had a high kill game, based on the skewness of the randoms’ histogram, there’s a chance they were not pulling their weight and our overall team might not have had what it takes to secure the win.
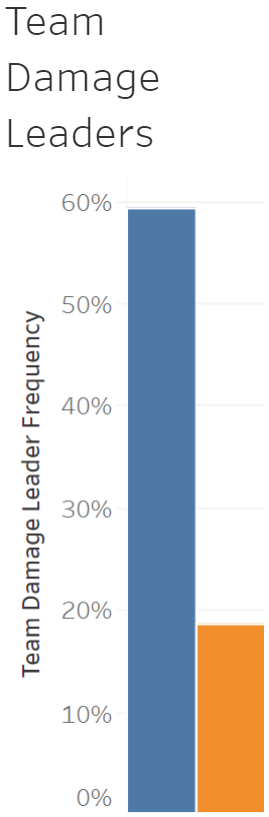
Speaking of pulling weight, I wanted to see how often I was the damage leader on my team in games with randoms. As shown on the below right graph, it’s nearly 60%.
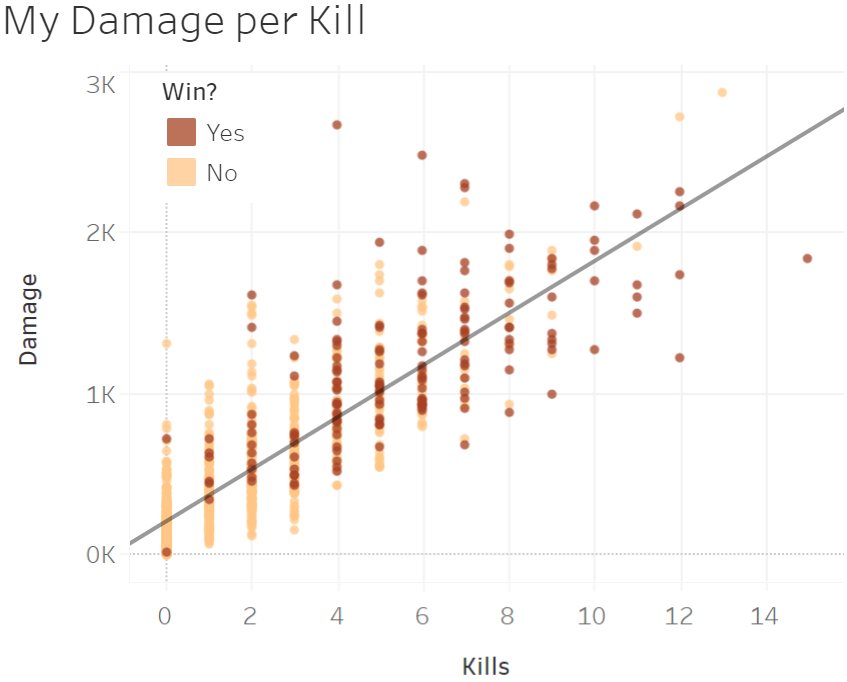
Considering damage output and kills, with an R-squared value of 0.72, there was a strong correlation between the two. I put in about 175-200 damage per kill, but it’s important to note there are exceptions to the rule. For example, one game I posted 1,304 damage with no kills and in another I had 1,213 damage with twelve kills 🤷♂️
Stats with respect to time
The correlation between damage and game length wasn’t as strong as damage per kill. However, toggling between myself and randoms shows that my damage cluster in games lasting longer than five minutes is generally higher on the damage axis. I put out about 65 damage per minute, whereas randoms hit 38 damage per minute.
And finally, the most important question of them all: did I improve over the course of 1,000 games?
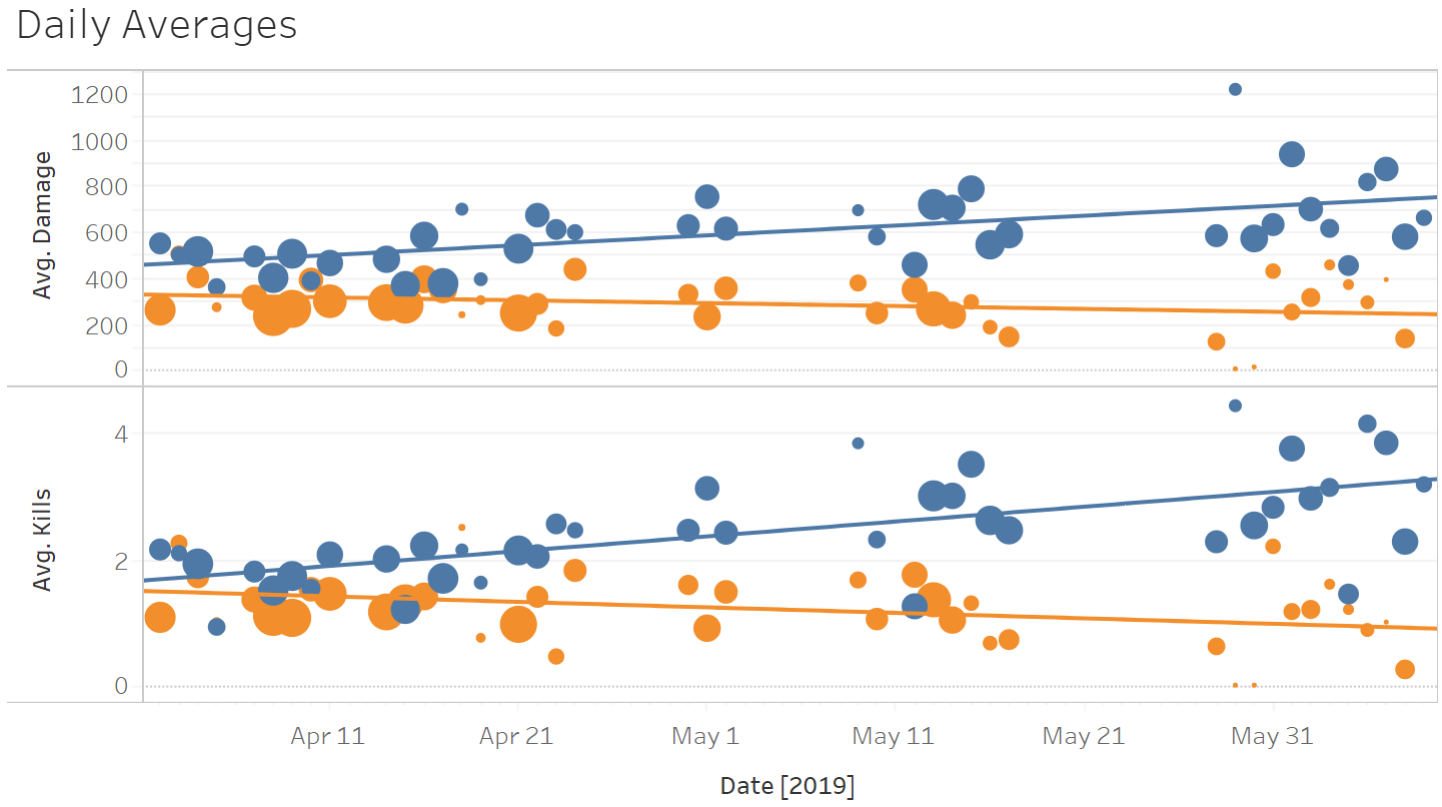
There was definitely a positive trend for my damage and kill output over the course of this two month window. I went from just under a 2.0 K/D and 500 average damage to a 3.0 K/D and nearly 800 average damage. In the FPS world, a K/D jump of one correlates to a pretty significant skill gap. It’s awesome to see the increased confidence in my gameplay is backed by quantitative improvements.
Randoms on the other hand, apparently got worse. I’m not sure how to explain this. It could be my improvement left less opportunities for randoms to get damage and kills. It could be that Respawn’s matchmaking algorithm paired me with more novice randoms as I got better at the game, in an attempt to create overall balance.
Oh well, that’s a question for later. For now, I gotta get back into King’s Canyon for the next 1,000. See you in the drop ship, friends!

Apex Tracker (2019)
The goal of this project was to get more practice building full stack serverless apps. I chose to use a third-party API to serve up player stats for Apex players.
Once a user selects their platform and enters their username, they can see the banner of their selected legend.

On the back end, every time a user enters their information, their stats are recorded as a timestamped DynamoDB entry.
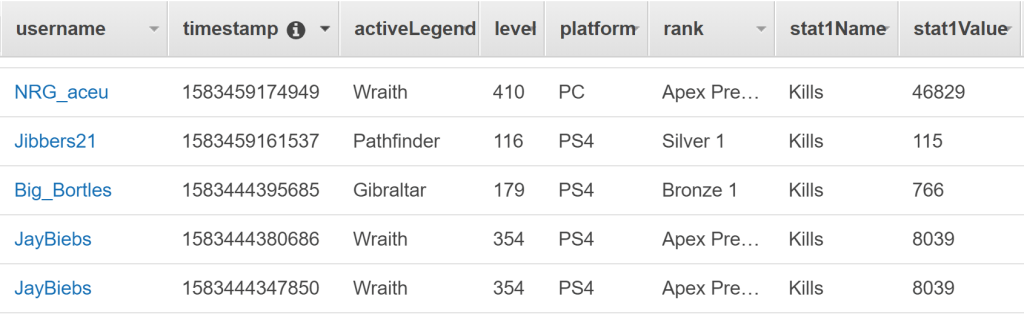
The idea behind storing data was to eventually track changes in stats over time as display those as graphs. However, with the unstable state of the third-party API and the fact that the only stats that can be updated are the ones equipped on the active legend’s banner, this project has been on hold. Regardless, this project was good practice for familiarizing myself with AWS features and Javascript/React.
