Early Pandemic Trends (2020)
In March of 2020, COVID consumed all news. I found myself wanting a simple snapshot of trends and daily stats, and created a live dashboard to show the latest in a digestible way. After sharing the dashboard with a friend, he shared it with his mom, the Chief Nurse Officer for Swedish Health Services. I was pleased to hear it was her go to tool for daily local and global info during the pandemic.
Check out the code for yourself on my GitHub. I used the Johns Hopkins GitHub repo as my data source.
Here’s a snapshot of the dashboard. I’ve stop hosting a live version, but please inquire if you’d like to see more details.

DASHBOARD FEATURES:
Coronavirus over Time
A look at worldwide cases and deaths over time.
Leading Countries and US States
A daily snapshot into the top-ten countries and states for confirmed cases and deaths.
US Counties
A daily snapshot of a county level choropleth map to get an idea of the latest in your neighborhood.
Global Time Series
A global choropleth map timeline to get a sense of how countries were affected at different dates.
TOOLS USED:
Dash by Plotly
plotly is my go-to choice for a simple quick and dirty web app using Python. There’s no Javascript required, so I can setup the entirety of my dashboard from back-end analysis to front-end graphs with one Python file.
Elastic Beanstalk by AWS
A quick option for deploy and managing applications in the AWS cloud. For a simple, one-page dashboard such as this one, Elastic Beanstalk makes sense.
FantaCSV Football (2018)
I lost in fantasy football this year. Barely made playoffs even though I had the most points, a tale as old as time for many FF enthusiasts. Every league member complains about bad-beats during the season, but I wanted my whining to be backed by data.
Here is an image of a dashboard I developed for my league. It pulled from ESPN’s API and gave league members insights into team performance that are not visible on ESPN’s league page.

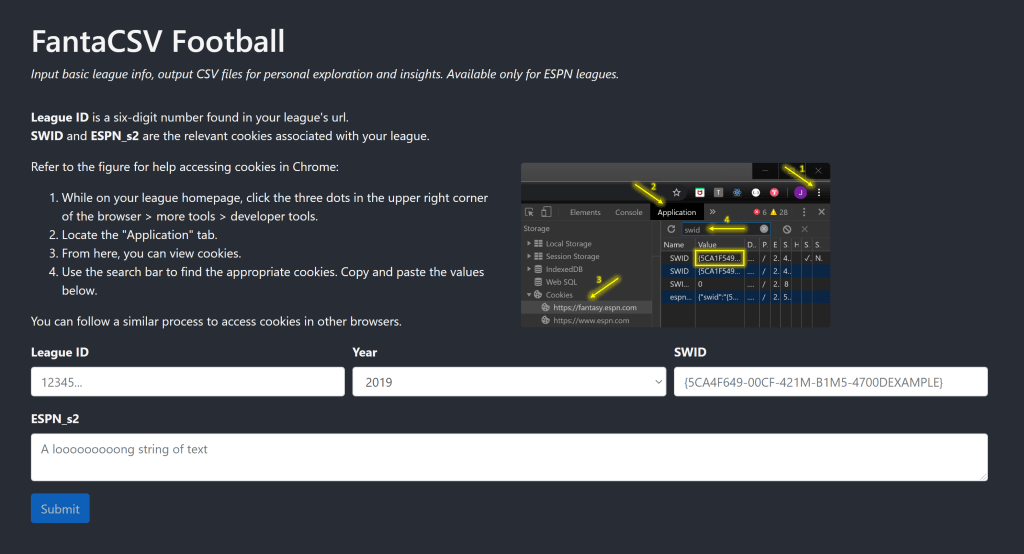
ESPN recently changed their API so that I couldn’t generate CSV files for this past season. FantaCSV is a single-page web app (no longer hosting, inquire for details) I built with React that remedies CSV generation through ESPN’s new API and is compatible across any active year for any league. Here’s what it looks like: